Coronavirus COVID-19 Thread

Radegast74

Space Marshal
Oct 8, 2016
3,003
10,665
2,900
RSI Handle
Radegast74
I ran across this graphic a day or two ago, this more clearly shows the stress the hospital "system" is under, and why the isolation measures to "flatten the curve" are needed...the hospitals simply don't have a lot of ICU beds to begin with and can get easily swamped. When that happens, people needlessly die (areas in gray don't have hospitals or ICU beds):
Screen Shot 2020-04-07 at 10.18.46 AM.png
 

NaffNaffBobFace

Space Marshal
Donor
Jan 5, 2016
11,816
43,442
3,150
RSI Handle
NaffNaffBobFace
Numbers for UK now updated:

Total confirmed cases 65,077 Total confirmed deaths 7,978:

Chartorama09-04-20.jpg


Silly bastards are now calling for lockdown to be lifted because it was originally stated there would be a review after 3 weeks, it's been 3 weeks and there is a bank holiday on the way. The two following charts are case counts by day for confirmed and deaths. It confuses me how some parts of the population cannot see we are no where near the down-slope on this:

1586458927944.png

1586458940241.png
 
  • Like
Reactions: Radegast74

Aramsolari

Space Marshal
Donor
May 9, 2019
2,297
7,812
2,250
RSI Handle
AramSolari
Numbers for UK now updated:
Silly bastards are now calling for lockdown to be lifted because it was originally stated there would be a review after 3 weeks, it's been 3 weeks and there is a bank holiday on the way. The two following charts are case counts by day for confirmed and deaths. It confuses me how some parts of the population cannot see we are no where near the down-slope on this:
I mean...Bojo is out of intensive care. That means back to business for the rest of you peasants!
 

Kaus_Borealis

Grand Admiral
Jun 9, 2019
61
188
1,200
RSI Handle
Kaus_Borealis
It's hard to say but the USA Government don't take the virus seriously.

A lot of flights over american airspace. You can compare: USA vs. The rest of the world.
 
Last edited:
  • Like
Reactions: NaffNaffBobFace

stockish

Space Marshal
Nov 24, 2018
767
2,325
2,000
RSI Handle
Stockish
AZ going to hit 100 deaths this week. But it has been slowly going so that is a good sign, the curve will be decently flat.
 

Bambooza

Space Marshal
Donor
Sep 25, 2017
5,697
17,949
2,875
RSI Handle
MrBambooza
I ran across this graphic a day or two ago, this more clearly shows the stress the hospital "system" is under, and why the isolation measures to "flatten the curve" are needed...the hospitals simply don't have a lot of ICU beds to begin with and can get easily swamped. When that happens, people needlessly die (areas in gray don't have hospitals or ICU beds):
View attachment 15434

This graphic would be helpful if instead of showing how many beds are taken up it also showed of the beds available what percentage is currently being utilized. And if there is a waiting list how deep is the waiting list.
 

NaffNaffBobFace

Space Marshal
Donor
Jan 5, 2016
11,816
43,442
3,150
RSI Handle
NaffNaffBobFace
Several UK GP's sent letters to an Autistic Care Group advising they put all of their wards on Do Not Resuscitate orders.


What. The. Actual. Fuck.
 

August

Space Marshal
Officer
Donor
Aug 27, 2018
2,789
10,363
2,250
RSI Handle
August-TEST
As at 3:00pm on 9 April 2020, there have been 6,103 confirmed cases of COVID-19 in Australia. There have been 90 new cases since 3:00pm yesterday.

 
  • Like
Reactions: NaffNaffBobFace

August

Space Marshal
Officer
Donor
Aug 27, 2018
2,789
10,363
2,250
RSI Handle
August-TEST
Australia's Deputy Chief Medical Officer says the country is "probably on the cusp" of forcing the coronavirus infection rate down to a point where the virus could die out, as case numbers continue slow in Victoria.
Details here

But if Australia had remained in the carefree world of COVID denialism, we'd be well on our way to as many as 150,000 dead, based on the modelling conclusions released by Deputy Chief Medical Officer Paul Kelly in mid-March. As Queensland's Premier Annastacia Palaszczuk disclosed this week, the initial modelling for her state had predicted up to 30,000 dead in Queensland alone.
Morrison (the Australian Prime Minister) has set politics aside. To his very great credit.

"There are no blue teams or red teams" he said last week. "There are no more unions or bosses. There are just Australians now, that's all that matters."
Editorial on the countries response.
 
Last edited:

NaffNaffBobFace

Space Marshal
Donor
Jan 5, 2016
11,816
43,442
3,150
RSI Handle
NaffNaffBobFace
UK numbers update for today the 10th April: a bit confusing. EDIT - They dumped nearly 3000 extra legacy confirmed cases in the data which has interfered with my numbers something delightful, there will be a spike for the 10th that I have not got the energy to contradict on my graph tonight.

73,758 total confirmed with 5,706 new cases and 8,958 total fatalities with 980 new deaths.

The confusing part comes from the official figures page:

1586548877427.png


The number of positive for today is 5,706 taking the total to 73,758. Yesterdays total was 65,077, so that's 8,681 more than yesterday, not 5,706... That's a 2,975 confirmed cases difference...?

I can see on the reporting page they are now incorporating the Pillar 2 cases (care staff) however with those numbers too it still doesn't quite match up...?

1586549451882.png


70,272 + 3,486 does = 73,758 but the difference between yesterdays 65,077 and 70,272 is 5,195 not 5,706... and if we add the Pillar 2 numbers assuming that was missed off it takes the raise to 9192...?

None of it matches up very well, so I'll still be using the total confirmed as my point of reference giving a contradictory 8681 new cases rather than the official 5,706:


EDIT - There was an infodump of nearly 3000 extra legacy confirmed cases in today's total confirmed cases, which explains the spike. Would be in line with the current rise if it were not for that, doing forward Pillar 2 (care staff) will be included in the figures which may make it look steeper than previous going forward:

Chartorama10-04-20.jpg


New Cases by day (legacy spike on the 10th):

New Cases Bar 10-04-20.png


New Fatalities by day:

New Fatal 10-04-20.png


I understand the confirmed cases being higher now they incorporate care givers confirmed numbers, it's just confusing me how nothing seems to be matching up exactly any more.
 
Last edited:

August

Space Marshal
Officer
Donor
Aug 27, 2018
2,789
10,363
2,250
RSI Handle
August-TEST
As at 3:00pm on 10 April 2020 AEST, there have been 6,203 confirmed cases of COVID-19 in Australia. There have been 100 new cases since 3:00pm yesterday. Of the 6,203 confirmed cases in Australia, 53 have died from COVID-19 and 3,141 have recovered. There are currently 263 admitted to hospital with Covid-19, and 74 of these are in intensive care.

 
  • Like
Reactions: NaffNaffBobFace

August

Space Marshal
Officer
Donor
Aug 27, 2018
2,789
10,363
2,250
RSI Handle
August-TEST
UK numbers update for today the 10th April: a bit confusing.

73,758 total confirmed with 5,706 new cases and 8,958 total fatalities with 980 new deaths.

The confusing part comes from the official figures page:

View attachment 15446

The number of positive for today is 5,706 taking the total to 73,758. Yesterdays total was 65,077, so that's 8,681 more than yesterday, not 5,706... That's a 2,975 confirmed cases difference...?

I can see on the reporting page they are now incorporating the Pillar 2 cases (care staff) however with those numbers too it still doesn't quite match up...?

View attachment 15447


70,272 + 3,486 does = 73,758 but adding 3,486 to 5,706 assuming they missed that off the main set of figures gives 9192...?

None of it matches up very well, so I'll still be using the total confirmed as my point of reference giving a contradictory 8681 new cases rather than the official 5,706:

View attachment 15450
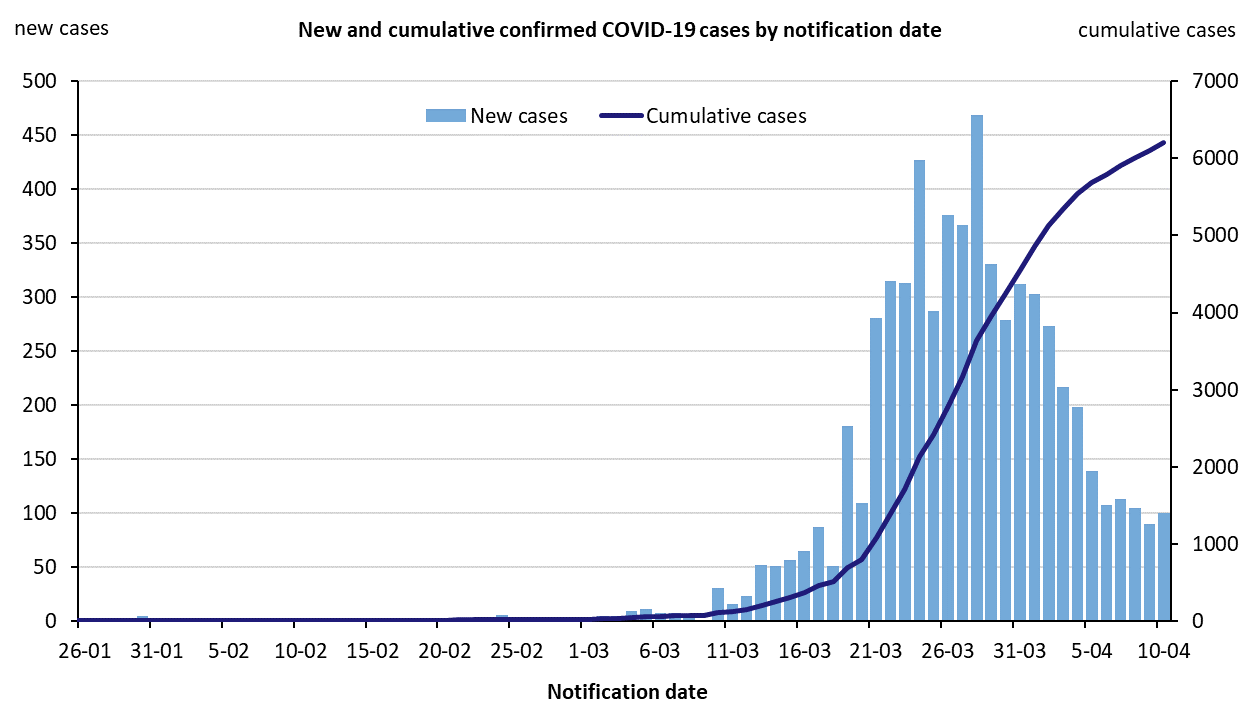
New Cases by day:

View attachment 15449

New Fatalities by day:

View attachment 15448

I understand the confirmed cases being higher now they incorporate care givers confirmed numbers, it's just confusing me how nothing seems to be matching up exactly any more.
The new cases per day has almost doubled, Naff Naff. Do you guys know what caused it?
 

NaffNaffBobFace

Space Marshal
Donor
Jan 5, 2016
11,816
43,442
3,150
RSI Handle
NaffNaffBobFace
The new cases per day has almost doubled, Naff Naff. Do you guys know what caused it?
I personally think the metric for measuring has changed and there are some legacy numbers thrown in which may have clouded the results.

According to the data page this is the first time they have added caregivers (health care staff) figures with the patents figures so I am assuming they have dumped ALL the recorded figures in there going back to the beginning:

"Incorporating figures on swab testing for critical key workers

Today’s figures for positive tests have been adjusted to include positive case results from swab testing for key workers and their households (pillar 2). These will be included in the daily figures from today, 10 April. If these results were excluded from the figures, as they have been previously, the daily increase in the number of people who tested positive would have been 5,195"
So that bit explains the 5,195 figure bumping up to 5,706 but doesn't totally explain my 8,681 figure given the other numbers provided....?

Unless it does - thinking about it if they have number-dumped a lot of legacy numbers in all in one day it could eplain my chart having such a higher rise than the official numbers. It may have been 5,706 yesterday, but with the legacy numbers included the jump really is 8,681 as it contains nearly 3000 extra cases...? We could both be right...? EDIT - We are and yes there was a legacy dump in the confirmed cases by adding another reporting stream from Pillar 2 which is care staff.

I don't expect this oddity to last beyond tomorrow, if it does the UK needs to take a good look at itself and ask exactly where it's arse is in relation to both of its hands in an ares-finding contest.

This does highlight just how little we know about the extent of the epidemic in the UK, as there is no testing outside of hospitals yet, it could be doing anything in the greater population.

EDIT - Yep I just crunched the numbers and the numbers of reported confirmed in Pillar 2 is 2975 which is the number I found different between my number and their 5,706 number.

Answer: A dump of legacy numbers all at once, the official number is 5,706 which includes that days Pillar 2 numbers, too. I have edited my post with graphs on to explain and will update my graph if I can ever concentrate long enough to put those numbers down.
 
Last edited:

NaffNaffBobFace

Space Marshal
Donor
Jan 5, 2016
11,816
43,442
3,150
RSI Handle
NaffNaffBobFace
The new cases per day has almost doubled, Naff Naff. Do you guys know what caused it?
So with the cause in nearly 3000 legacy cases being infodumped in the data I've updated my spreadsheet to take into account the daily inclusion in Pillar 2 confirmed cases. It's difference is minimal the highest is the 7th of April with 374 so its not like they all happened on the same day, and the data for the 9th is missing entirely so I'll carry on tomorrow with the updated line in the hopes the 9th info will be included by that time too.
 
Last edited:

Rear_Intruder

Space Marshal
Donor
Jun 9, 2017
737
2,625
2,650
RSI Handle
Rear_Intruder
I did not read the previous 49 pages so sorry if I am repeating stuff

Tin foil hat time. I just had a look at the Office for National Statistics (ONS) stats for England and Wales deaths, that was released on 07/04/20. In the 9 weeks before 27/3/20 at total of 98,899 people died of all causes. Any guesses how much higher that is than the average for the same period in the previous 5 years IE 2015-2019?

Obviously my maths may be wrong and a there are a lot of factors in play.

The answer is that 2996 fewer people died in that period in 2020 than in the average of the previous five years.


Open the first xisx it gives the comparison at the top


If you use the link open the first xisx it gives the comparison at the top

Honest and crackpot thoughts please?


In general conspiracy's do not work. I believe in incompetence and poor judgement. There is no doubt that people are dying of Covid 19. My main point is are the steps taken by the government proportional? I would stress that whilst I think the answer is no, I am still following the rules as I am wrong 49% of the time😇. Being wrong on this is a big risk to my family.
 
Last edited:

Radegast74

Space Marshal
Oct 8, 2016
3,003
10,665
2,900
RSI Handle
Radegast74
I see
I did not read the previous 49 pages so sorry if I am repeating stuff

Tin foil hat time. I just had a look at the Office for National Statistics (ONS) stats for England and Wales deaths, that was released on 07/04/20. In the 9 weeks before 27/3/20 at total of 98,899 people died of all causes. Any guesses how much higher that is than the average for the same period in the previous 5 years IE 2015-2019?

Obviously my maths may be wrong and a there are a lot of factors in play.

The answer is that 2996 fewer people died in that period in 2020 than in the average of the previous five years.


Open the first xisx it gives the comparison at the top

View attachment 15464

If you use the link open the first xisx it gives the comparison at the top

Honest and crackpot thoughts please?


In general conspiracy's do not work. I believe in incompetence and poor judgement. There is no doubt that people are dying of Covid 19. My main point is are the steps taken by the government proportional. I would stress that whilst I think the answer is no, I am still following the rules as I am wrong 49% of the time. Being wrong on this is a big risk to my family.
Well, if you aren't going to read all the 49 previous pages, then I'm not going to fully read your post, either, :p

My stab at answering the question is either
a) they aren't updating that list or are too swamped by tracking the COVID-19 deaths to track other things,
OR
b) if people aren't outside driving, working, etc., then there has been a reduction in road deaths, workplace deaths, sporting/accidental deaths, etc.

Or some combo of the two. Or something else, also. If it is indeed b, then look for a rebound when people are let loose from isolation.
 
Forgot your password?